The Greens had a particularly good showing in the 2010 Federal election, winning their first lower house seat in a general election, receiving their highest ever share of the primary vote, and increasing their Senate representation to nine. Concerns have been raised in the Victorian state branch of the ALP, however, that these gains came at the expense of the ALP. So, how seriously should the ALP be concerned about the Greens?
To examine this issue, I created state-specific scatter plots tracking electorate-level results from the last four Federal elections. In each plot, the vertical axis represents the percentage of primary votes cast in favour of the Greens while the horizontal axis represents the ALP two candidate preferred vote.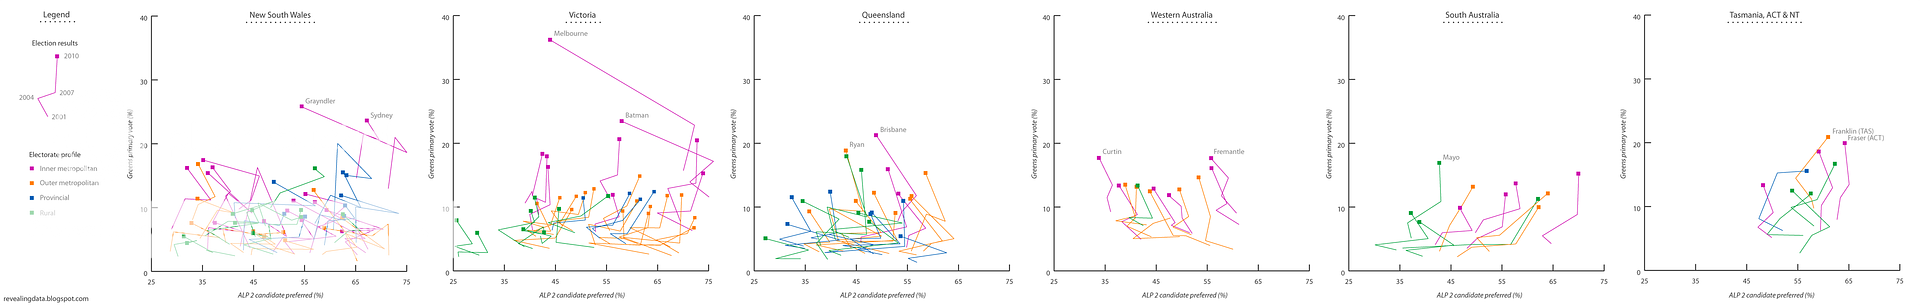
As the plots indicate, the Greens primary vote has been rising since the 2001 election. These increases have occurred irrespective of whether the ALP two candidate preferred vote has trended towards the ALP (Victoria, South Australia, Tasmania, ACT, NT), away from the ALP (Western Australia), or moved in every-which direction (New South Wales, Queensland). As such, there does not appear to be a consistent relationship between the Greens primary vote and the ALP two candidate preferred vote.
So, should the ALP be worried? Yes and no. In most electorates, the Greens are unlikely to threaten ALP candidates, at least in the foreseeable future. The exceptions are in inner-city electorates held by ALP MPs. In 2010, for instance, the Greens primary vote exceeded that of the Liberal Party in three electorates (Grayndler, Melbourne, and Batman), forcing a run-off between the Greens and the ALP. One of these electorates (Melbourne) ended up going to the Greens, and future gains in the Greens primary vote could also see the seats of Grayndler and Batman come into contention.
Notes:
- An explanation of the two candidate preferred vote can be found at the AEC website.
- Four electorates (Kennedy, Lyne, New England, and O’Connor) were not included in the plots because the ALP was not represented in the Two Candidate Preferred Vote.
Asylum seekers are back in the news following recent comments by Julia Gillard and Tony Abbott. Unfortunately, neither politician appears to be doing much to contextualise the numbers that lie at the heart of this issue.
As the graph below shows, there was a spike in the number of so-called ‘unauthorised boat arrivals’ during the 2008-2009 financial year. Nevertheless, more unauthorised entries were detected at Australia’s airports than in Australia’s waters. And from an international perspective, the number of unauthorised boat arrivals entering Australia is miniscule.
For the interested reader, Robert Carr has also created an infographic on this issue.
Notes:
- The USA figures cited above were for the US Government’s financial year, which begins October 1 and ends September 30.
- There was a discrepancy of 7 people between the figures supplied by DIAC to the Senate and the figures that appeared in their 2008-09 annual report. The smaller figure of 985 was used to formulate this infographic.
- Department of Immigration and Citizenship – Question taken on notice
- Department of Immigration and Citizenship – Annual report 2008-09: Table 1
- White House - Blog
- UK Home Office - Research development statistics
- United Nations High Commissioner for Refugees – 2009 Global trends: Table 2