Discussions about mitigating the effects of climate change invariably lead to national comparisons of greenhouse gas emissions, and such comparisons reveal that China is the world’s largest emitter of CO2, followed closely by the USA. One of the problems associated with such comparisons, however, is that they fail to account for national differences in population. A fairer comparison would therefore be to examine per capita CO2 emissions.
The graph below contains the per capita CO2 emissions of various nations in 1990 and 2007. As the graph reveals, many nations throughout this period experienced dramatic growth in per capita CO2 emissions, and this growth was particularly evident in the Asia-Pacific region. It should be noted, however, that much of this growth took place off the back of low per capita CO2 emissions.
Juxtaposed with this growth was the small to moderate declines in per capita CO2 emissions throughout Western Europe and the former Soviet Union. Nevertheless, per capita CO2 emissions in many of these nations still remained high. If we are to take to heart Jefferson’s sentiment that ‘all men are created equal’, then we must move towards a future where everyone has the same right to emit the same (sustainable) amount of CO2.
Source:
- International Energy Agency: CO2 emissions from fuel combustion 2009 - pp. 89-91
The Tour de France has just entered the second week of racing, and I’m tired. In a good way. Because if you’re an Australian fan of the Tour de France and you like to watch each stage live, you must be prepared to lose a little shut eye.
While I love the TV coverage of the race, it can sometimes be difficult to gauge how cyclists who are not race favourites fare on each particular stage. To this end, I created a graph using data from the 2009 Tour de France to determine the stages that had a major effect on cyclists’ times.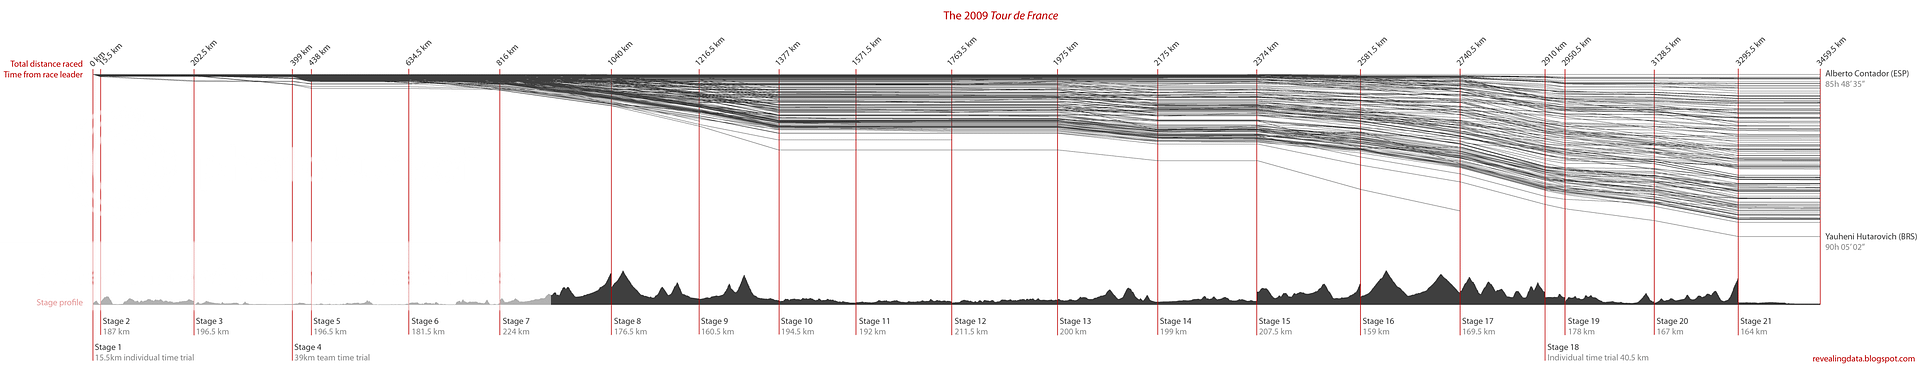
Source:
- Amaury Sport Organisation – Tour de France website
In an earlier post, I showed some of the macro trends associated with obesity in the USA. In particular, I showed how increases in the price of fruit and vegetables relative to the price of soda and sugar were associated with rises in BMI and energy intake. In this post, I take a more focused look at the issue of obesity in the USA.
The graph below shows how the maximum serving size of several products offered by McDonalds and Burger King has changed over time. What is particularly noteworthy is that the amount of soda currently served to children at McDonalds is larger than the largest serving size available in the 1950s. It is also apparent that since the 1950s, the maximum serving sizes available for soda, French fries, and hamburgers have increased dramatically. Food for thought!
Sources:
- National Center for Health Statistics – Prevalence of overweight, obesity and extreme obesity among adults: Table 2
- Young & Nestle (2003) – Expanding portion sizes in the US marketplace: Implications for nutrition counseling: Table 2
- Young & Nestle (2007) – Portion sizes and obesity: Responses of fast-food companies: Table 1
Asylum seekers are back in the news following recent comments by Julia Gillard and Tony Abbott. Unfortunately, neither politician appears to be doing much to contextualise the numbers that lie at the heart of this issue.
As the graph below shows, there was a spike in the number of so-called ‘unauthorised boat arrivals’ during the 2008-2009 financial year. Nevertheless, more unauthorised entries were detected at Australia’s airports than in Australia’s waters. And from an international perspective, the number of unauthorised boat arrivals entering Australia is miniscule.
For the interested reader, Robert Carr has also created an infographic on this issue.
Notes:
- The USA figures cited above were for the US Government’s financial year, which begins October 1 and ends September 30.
- There was a discrepancy of 7 people between the figures supplied by DIAC to the Senate and the figures that appeared in their 2008-09 annual report. The smaller figure of 985 was used to formulate this infographic.
- Department of Immigration and Citizenship – Question taken on notice
- Department of Immigration and Citizenship – Annual report 2008-09: Table 1
- White House - Blog
- UK Home Office - Research development statistics
- United Nations High Commissioner for Refugees – 2009 Global trends: Table 2
This graph plots the growing proportion of Americans who are classified as being overweight or obese. This upward (or outward!) trend coincides with increases in both daily energy intake and the relative price of fruit and vegetables.
Sources:
- National Center for Health Statistics – Prevalence of overweight, obesity and extreme obesity among adults: Table 2
- Centers for Disease Prevention and Control – Health, United States, 2009: Table 70
- US Bureau of Labor Statistics – Consumer price index: All urban consumers