During the early 2000s, I probably watched most of the international test cricket matches played on Australian shores. Perhaps unsurprisingly, this period also coincided with Australia’s dominance in the world of test cricket. Australia had not, however, always been so successful. In the 1980s, for example, the West Indies were the most dominant international team and the Australian side enjoyed only sporadic success. Similarly, in the last couple of years, Australia has had fewer series wins than India or South Africa. Which got me thinking: how could I best represent the cyclicality of test cricket success? The graph below is my attempt.
In this graph, I’ve only included test sides that have been ranked number one at least once since 1971. Thus, New Zealand, Pakistan, Sri Lanka, Zimbabwe, and Bangladesh are not included. The height of each arc represents the number of consecutive test series that each side won (or lost), and the spacing between each arc represents the length of time that this run of wins or losses lasted. Flat lines (i.e., when no arcs are present) refer to drawn test series.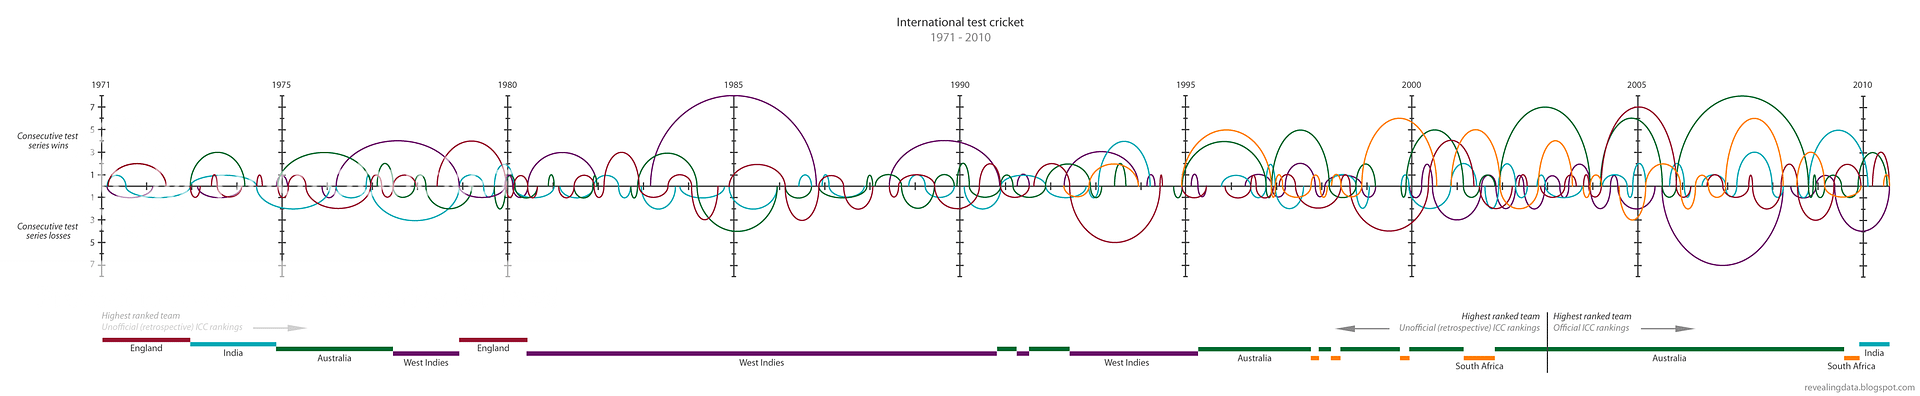
Notes:
- South Africa was excluded from international cricket during the apartheid era, re-entering the international test arena in 1992.
- Official ICC rankings were introduced in 2003. The unofficial rankings presented here were calculated by Dave Wilson.
Sources:
- Howstat - Test series results
- Dave Wilson - Unofficial (retrospective) ICC rankings
- International Cricket Council – Official ICC rankings
No comments:
Post a Comment